




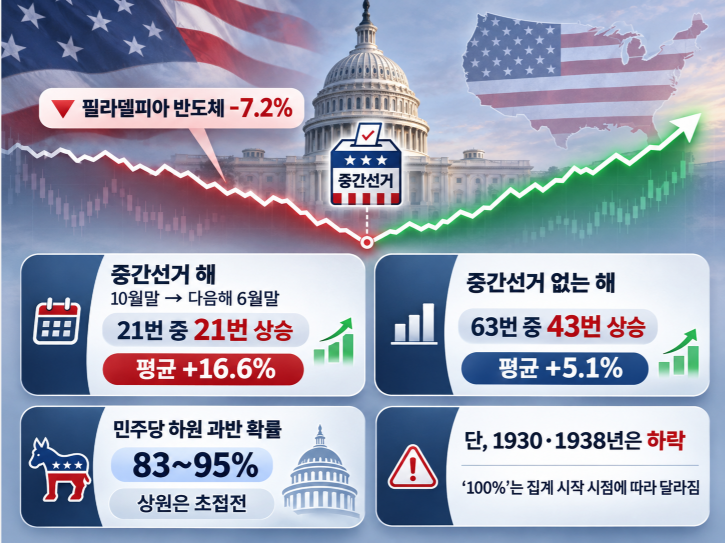
Following Friday's sharp pullback on Wall Street—particularly the 7.2% plunge in the Philadelphia Semiconductor Index—local Korean markets are bracing for a difficult trading session.
Amidst this backdrop, the U.S. midterm elections on November 3rd are rapidly approaching.
As of October 31, consensus polling averages place public support for the Democratic Party at 52.1% and the Republican Party at 43.5%.
Election forecasting models and prediction markets currently peg the probability of the Democrats retaining a majority in the House of Representatives (218 seats or more) at 83% to 95%.
While the likelihood of Democrats securing 51 seats in the Senate ranges between 63% and 75%, key battleground regions remain in a dead heat with narrow approval rating gaps of 0.2 to 2.3 percentage points.
Early voting turnout has outpaced previous midterm elections, making high voter mobilization from both parties a critical variable.
As U.S. midterms draw near, a familiar chart frequently circulates among securities analysts.
An analysis of S&P 500 returns dating back to 1942 reveals a distinct pattern: Wall Street typically experiences heightened volatility ahead of midterms, followed by a strong rebound once the elections conclude.
The core message of this circulating chart is striking:
"Comparing the closing price at the end of October in a midterm year to the end of June the following year, all 21 midterm cycles yielded positive returns, averaging +16.6%."
In other words, rolling the dice 21 times resulted in a 100% win rate and an average return of 16.6%.
The numbers themselves are factually accurate.
All 21 instances resulted in gains, translating to a 100% success rate with an average return of 16.6%. The smallest gain was recorded in 2014 at +3%.
Because these calculations exclude dividends, actual total returns would be slightly higher.
By comparison, looking at the same period (end of October to the end of June) in non-midterm years reveals that out of 63 instances, 43 were positive and 20 were negative.
The average gain during non-midterm years stood at 5.1%—significantly lower than the 16.6% seen during midterm cycles—with notable drawdowns, such as a 25.2% decline in 1969.
Though the sample size is limited, a clear divergence is visible.
The psychological drivers behind Wall Street's post-midterm rallies are easy to understand.
Just as students feel a sense of relief once an exam is over—regardless of the score—simply because the uncertainty has lifted, markets operate similarly.
Markets inherently detest uncertainty far more than they dislike bad news.
Midterm elections typically result in the incumbent president's party losing congressional seats, frequently giving rise to a "divided government."
A divided government occurs when the party holding the presidency differs from the party controlling Congress.
When a single party controls the White House, the Senate, and the House, it constitutes a unified government; losing control of either chamber of Congress creates a divided government.
In the United States, legislation requires approval from both the House and the Senate, followed by the president's signature, to become law.
If a roadblock emerges in just one of these three branches, the bill fails to pass.
Consequently, only moderate, bipartisan legislation tends to clear this hurdle.
Because the risk of abrupt, sweeping policy changes diminishes, industries and corporations become much easier to forecast.
This is why market participants often argue that an "inactive government" is not necessarily bad for stocks.
Another driver behind post-midterm market gains is the reality that "a presidential election is just two years away."
The administration and the ruling party are heavily incentivized to stimulate the economy, a dynamic frequently cited as the catalyst for post-midterm market strength.
With the S&P 500 closing at 7,580 on October 30 this year, a 16.6% rally would push the index to 8,840 by the end of June next year.
The key question to watch is whether the historical record of 21-for-21 will extend to 22-and-22 by the end of June next year.
However, investors must recognize that this statistical analysis contains a subtle trap.
The dataset begins tracking from 1942.
Expanding the historical data back to 1930 reveals that Wall Street experienced post-midterm market declines in both 1930 and 1938.
The 100% win rate is merely a byproduct of starting the dataset in 1942.
That said, the underlying premise—that the probability of a market rally following midterm elections is historically high—remains true.
One-Line Commentary.
The claim that the stock market has a 100% probability of rising after a midterm election depends entirely on the chosen baseline timeframe. While the statistical probability is undeniably high, statistics can be massaged in numerous ways, requiring investors to approach them with caution. Today's market pressures might make it hard to look past the immediate session, let alone the post-midterm outlook...
Source: Mer's Blog - Organizing the world from a different perspective.
https://blog.naver.com/ranto28
This article has been reconfigured from Mer's blog posts with the author's consent. All content may contain errors and does not constitute a recommendation to buy or sell, and thus cannot be used as a basis for investment decisions. Under no circumstances can the contents of this post be used as legal evidence.